Integrated cloud-based solutions
We are happy to share our seventh quarterly report on key financial metrics composites for Q4 2022, aggregated based on the data received from you!
The upward trend on New Vehicle units YOY sales has hit a break and is now starting to head downhill. The YOY sales dropped 14% in Q4. This trend is also reflected in a recent CNBC article that states:
 Industry estimates range from 13.7 million to 13.9 million new vehicles being sold last year in the U.S., a roughly 8% to 9% decline compared with 2021 and the lowest level since 2011 when sales were recovering from the Great Recession.
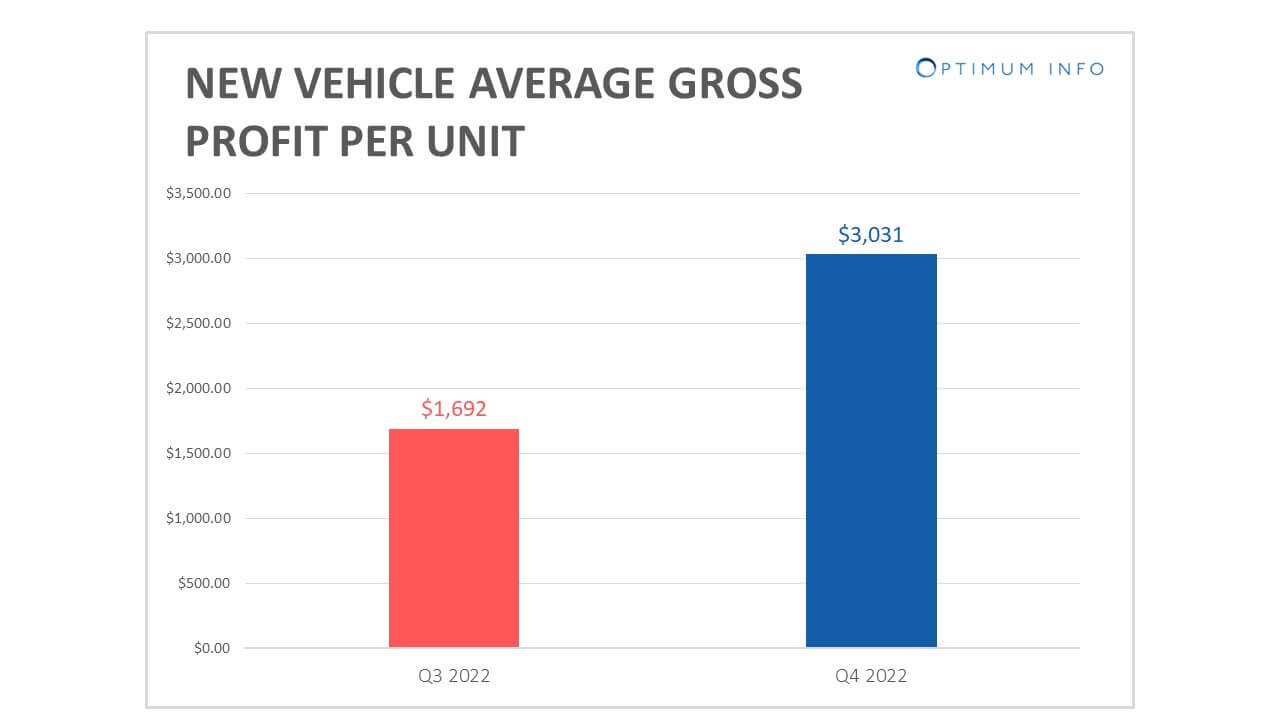
On a positive note, the average New Vehicle Sales gross profit continued their upward trend, increasing 79% from $1,692 to $3,031 per unit, though it could be just the momentum of previous periods.
Industry estimates range from 13.7 million to 13.9 million new vehicles being sold last year in the U.S., a roughly 8% to 9% decline compared with 2021 and the lowest level since 2011 when sales were recovering from the Great Recession.
On a positive note, the average New Vehicle Sales gross profit continued their upward trend, increasing 79% from $1,692 to $3,031 per unit, though it could be just the momentum of previous periods.
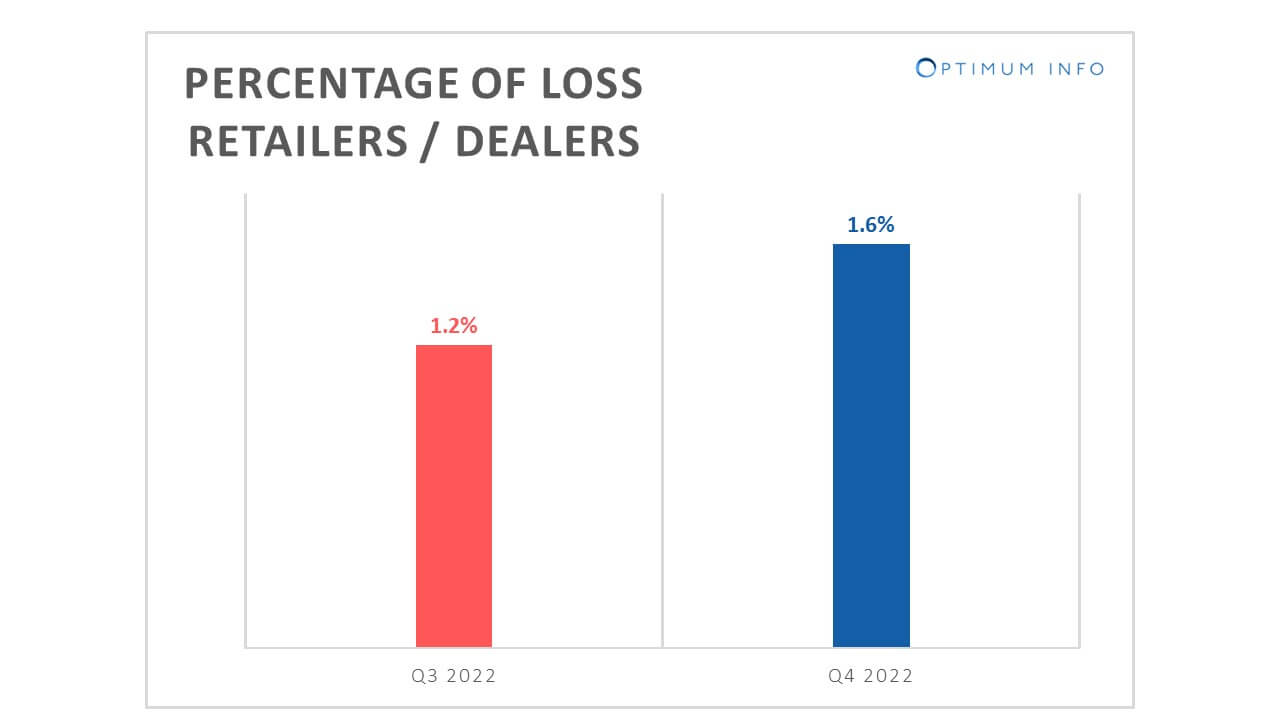
Net profit drops for the first time YOY, after seven consecutive quarters of growth. ROS is at 5.7% compared to 5.8% previously, while in the last quarter was at 6.1%. While Gross Profit % Sales slightly increased to 14.5%, the Operating Expense as % Sales increased at almost the same rate, resulting in Operating Profit % Sales marginally increased from 2.3% to 2.5%. The percentage of loss-making retailers has increased by 0.4 percentage points from 1.2% to 1.6% of the network.
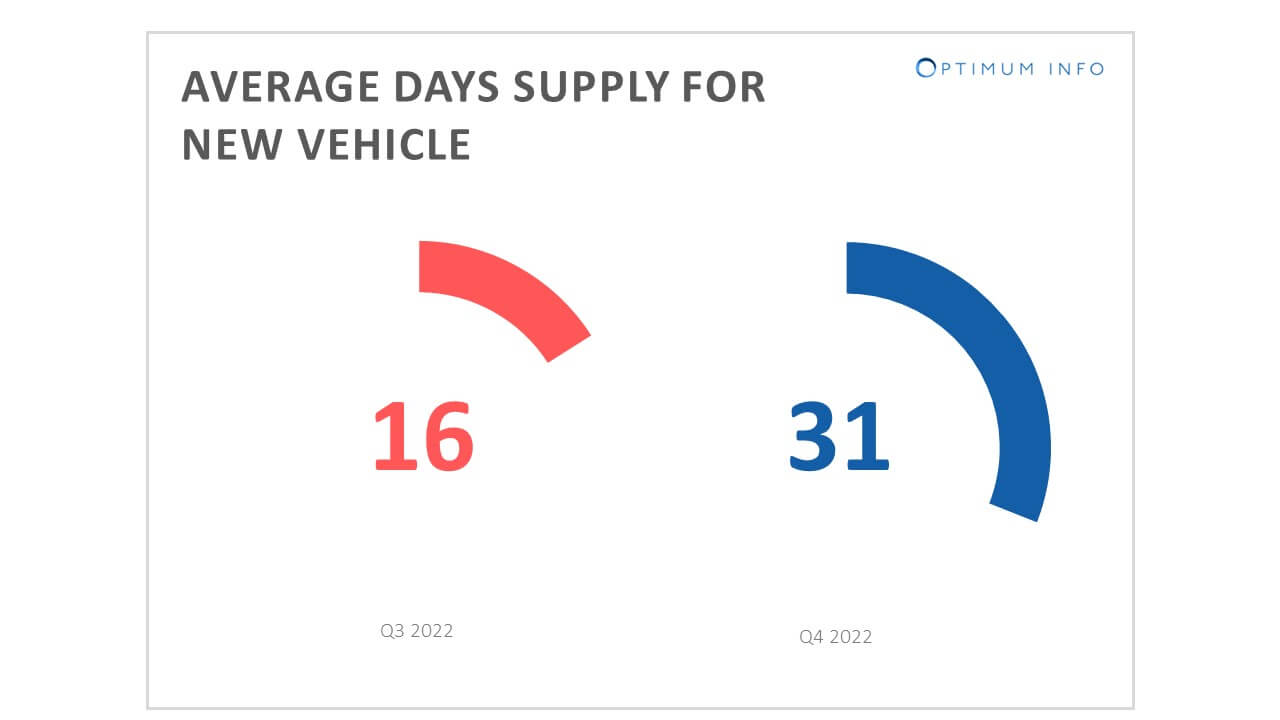
New Retail vehicles for December YTD dropped 14% YOY from 62 to 53 units/dealer per month. Average New Vehicle Sales price increased 9% from $41,490 to $45,308. The combination of increased sales price and surging interest rates that dampened demand, with limited incentives from manufacturer, and improved New Vehicle supplies in 4th quarter, have all contributed to the Days Supply increase from 16 days to 31 days.
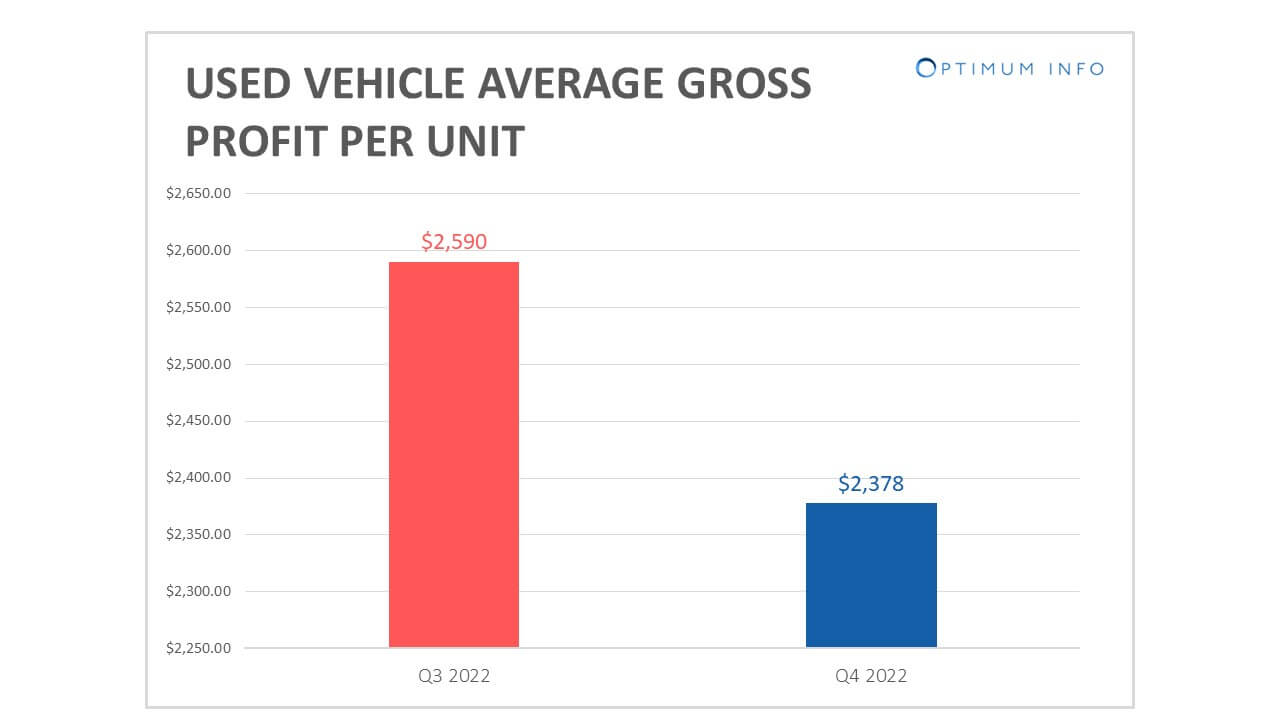
he Used Vehicles market mirrored the same trend as New Vehicles where the Total Used vehicles dropped 13% from 785 to 687 units/dealer/year YOY. The Average Used Retail sales increased 20% to $$29,724/unit. Average Used Retail sales gross profit declined 8% from $2,590 to $2,378/unit. However, due to the economy and higher interest rates, the demand for Used Vehicle Sales has also slowed down significantly. All brands show the same downward trend in the Used Vehicle department in units sold and gross profit retained.
NCM Associates reports that there has been much discussion of the consumer price index showing used vehicle prices falling another 1.9% between December and January and prices were 11.6% lower year-over-year. The disinflation is real, but the prices are still 37.2% higher than they were prior to the pandemic. When taking the 10-year average prior to the pandemic, today’s consumer price index for used vehicles is still 31.2% higher than that decade-long average.
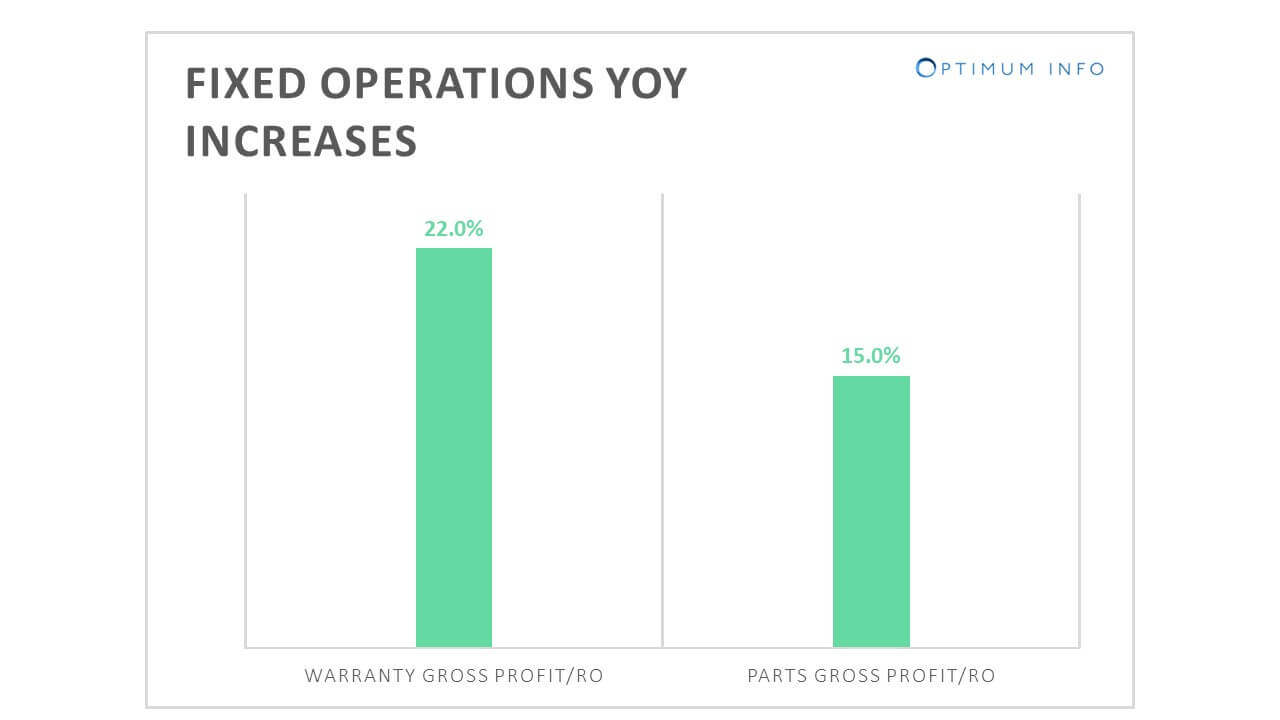
The Fixed Operations have been very stable and are now contributing more significantly to dealer profitability.
In Q4, the total RO count for the Composite Exclusive decline trend continues at 10% (13,146 ROs to 11,786 ROs). However, the Customer Pay Sales per RO increased appreciably by 17% and the GP increased by 19% YOY.
In a similar fashion, Warranty Sales per RO increased by 22% YOY and GP increased is slowing down to 13% YOY for Composite Exclusive, compared with 20% YOY last quarter.
Total Parts Sales and Gross Profit per RO increased 15% YOY and Parts Inventory increased 7% from $407,725 to $437,565.
Fixed Absorption continues with the upward trend with the marginal 3.1 percentage point increase from 52.6% to 55.7%.
Below are the continuing trends as agreed by the analysts in automotive retail market with a few items shifted:
GDP increases after three straight declining quarters. Based on the trends above, the consensus among the analysts is positive. Since demand remains strong and the chip shortage may be ending, new vehicle production will increase, which provides more supply to the market, hence, more sales.
However, the growth is unlikely to replicate the 2021-2022 period. At the same time, emerging mega-trends particularly around electrification are something to keep a close eye on!
Let us know how we can help you learn more.


