Integrated cloud-based solutions
The first months of 2023 have passed rather quickly, and we are once again ready to share our Q1 report summarizing key metrics derived from the dealer submissions we receive. Last year’s quarterly trends have been one of the most exciting and pivotal points in automotive history. Now, Q1 2023 seems to be softly but surely heading downward due to mixed consumer confidence in the continuing uncertain economic outlook.
After the first YOY drop in Q4 2022, the New Vehicle units bounced back in Q1 2023 and increased 11% from 142 to 158 units/per dealer. The strong unit sales in Q1 were supported by an improving inventory availability which is evidenced in the increase in days of supply. The 11% increase reported by our customers is 5 percentage point above the industry average as reported in Cox Automotives: “Through Q1, the seasonally adjusted annual rate (SAAR) is forecast at 15.0 million, an increase of more than 6% compared to the 14.1 million SAAR in the first quarter of 2022.”
On the other hand, the average New Vehicle Sales gross profit did not hold in Q1 as it dropped considerably by 47% YOY from $3460 to $1826 per unit.
Net profit as % of Sales also follows the downward trends, significantly dropping this quarter, from 6.0% compared to 4.3%. The minimal decrease in Gross Profit % Sales from 15.5% to 13.4%, combined with the flat YOY change in Operating Expense as % Sales, reduces the impact of loss on gross profit. The combination of increased sales with a decrease in Gross Profit % of Sales resulted in a lower Operating Profit % Sales from 3.1% to 1.1%. The overall impact of this unfavorable trend is shown in the percentage of loss-making retailers where it grew by 4.4 percentage points from 2.2% to 6.6% of the network.
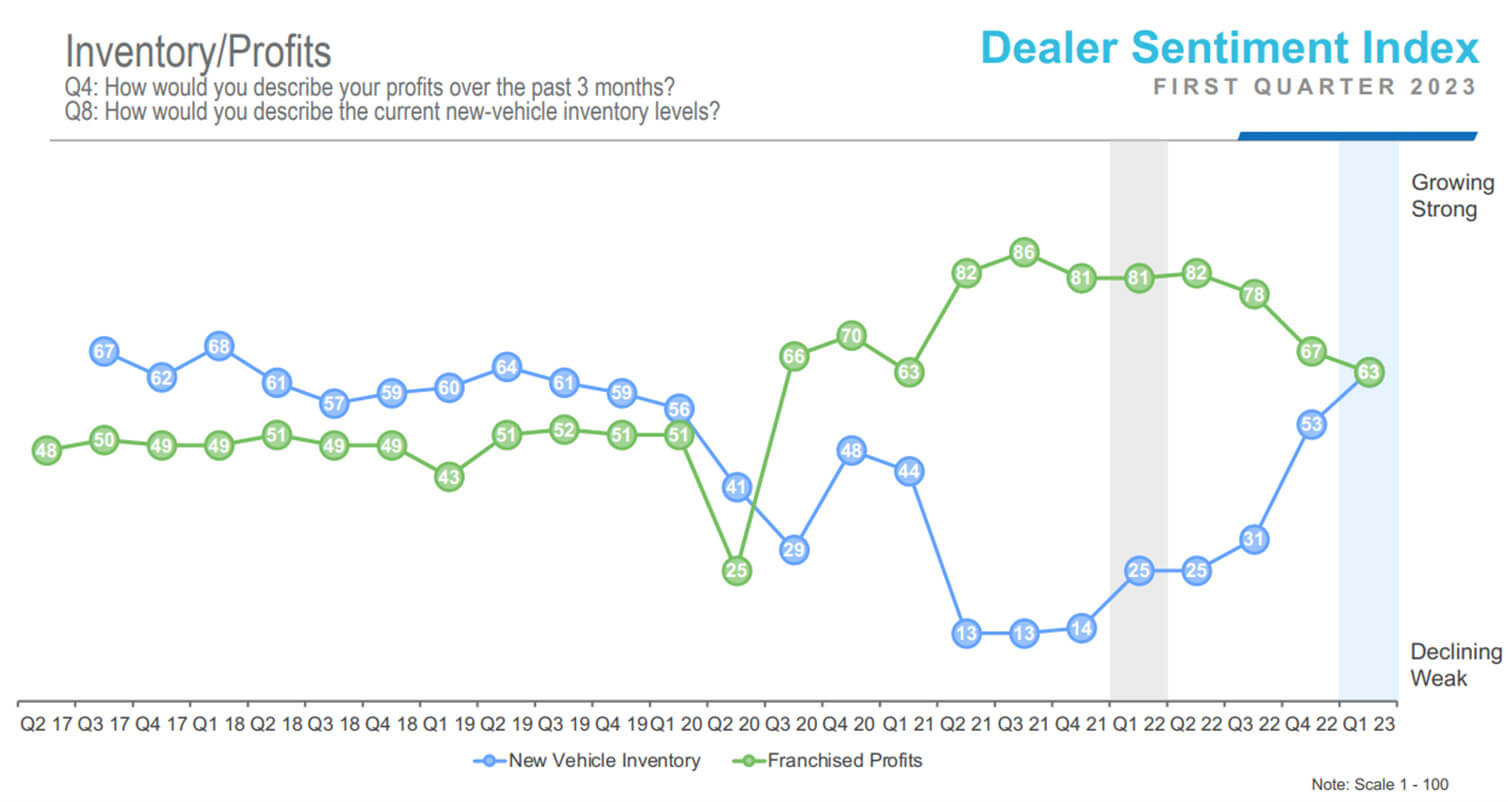 *Cox Automotive DSI
New Retail vehicles for Mar YTD increased 11% YOY from 48 to 54 units/dealer per month. Average New Vehicle Sales price slightly increased 1% from $44,740 to $45,123. The recent surge of New Vehicle supplies in most OEMs and the interest rates hikes that don’t seem to slow down, pushed the Days Supply higher this quarter from 19 days to 40 days. Currently, the number of Days Supply is trending to a pre-pandemic level.
 *Cox Automotive DSI
The Used Vehicles market narrowly trails the New Vehicle sales surge, up from 170 to 177 units/dealer/year YOY or 4% increase. The Average Used Retail sales decreased for the first time in the last 8 consecutive quarters from $29,734/unit to $27,613/unit. Average Used Retail sales gross profit follows the adverse YOY trend of 23%, down to $2,101/unit from $2,740/unit.
Despite the 5% YOY decline in the Service ROs, the Sales per RO and Gross Profit per RO increased more than 10% in Customer Pay and Warranty. The CP Sales per RO and Warranty RO increased 13% and 20% respectively YOY. The Gross Profit per RO for Sales and Warranty increased 14% and 21% respectively.
Total Parts Sales per RO increased 6% YOY and Gross Profit per RO increased 9% YOY. Parts Inventory slightly increased by 3% from $387,929 to $398,005.
Service Absorption continues with the positive trend at the marginal 5.6 percentage point increase from 53.6% to 59.2%.
Below are the continuing trends as agreed by the analysts in automotive retail market with a few items shifted:
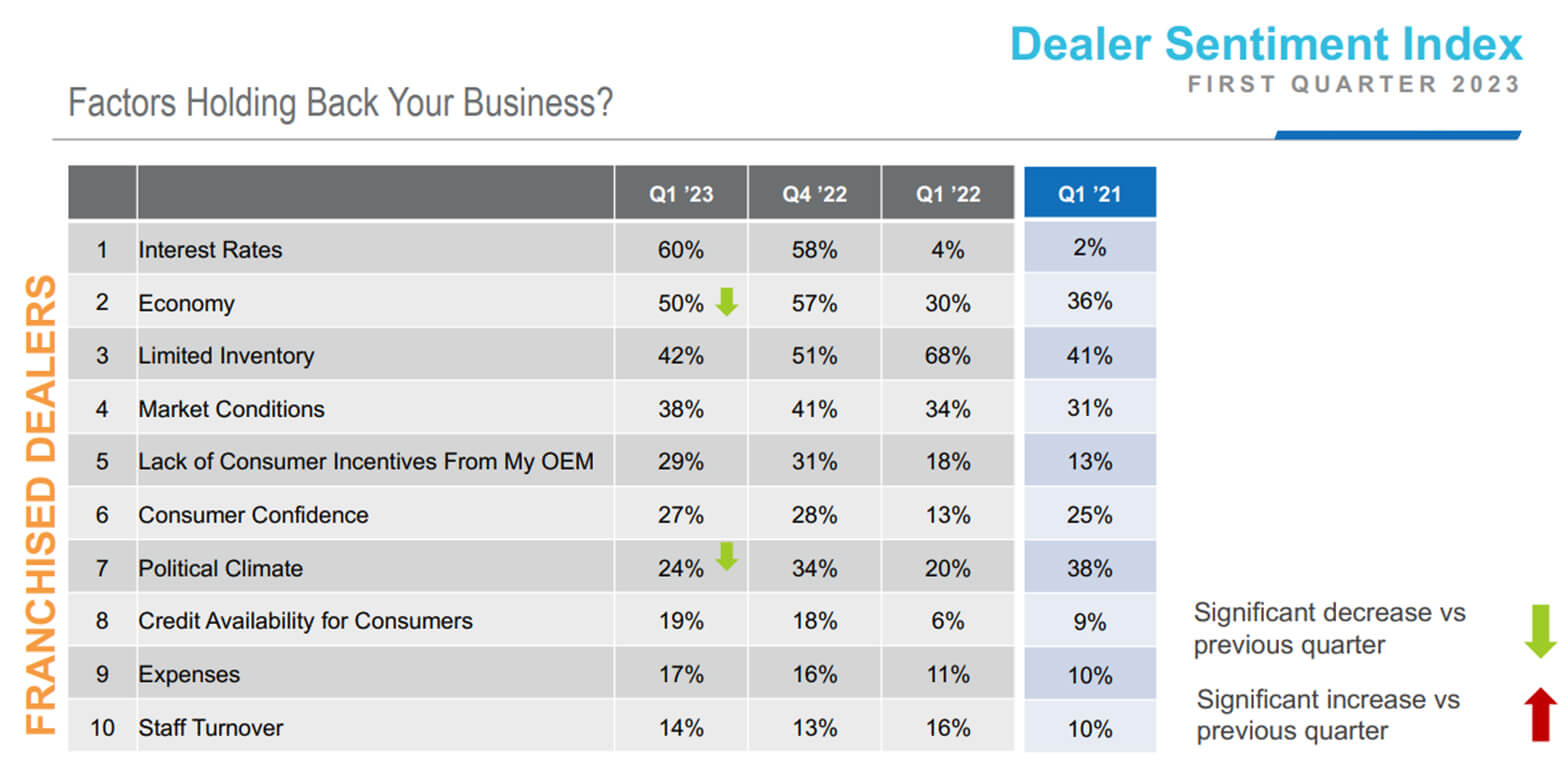 *Cox Automotive DSI
Although Q1 2023 shows an increase in vehicle sales, the gross profit and net profit dropped significantly YOY. Based on the interest rate, more inventory supply and uncertain economic outlook, the upward trend may be heading the opposite direction for the remaining quarters.

Linda is a Business Management and Financial Analysis expert with experience in the Automotive Industry working for renowned OEMs.

Mark has devoted an entire career in the Automotive Industry with both OEMs and dealers thanks to an unmatched passion for cars.
Let us know how we can help you learn more.


